User Panel
The User Interface is the core part of CDR-Stats, this is the one that the users will use to get reporting and take advantage of CDR-Stats capabilities and features.
The User UI is located at http://localhost:8000/
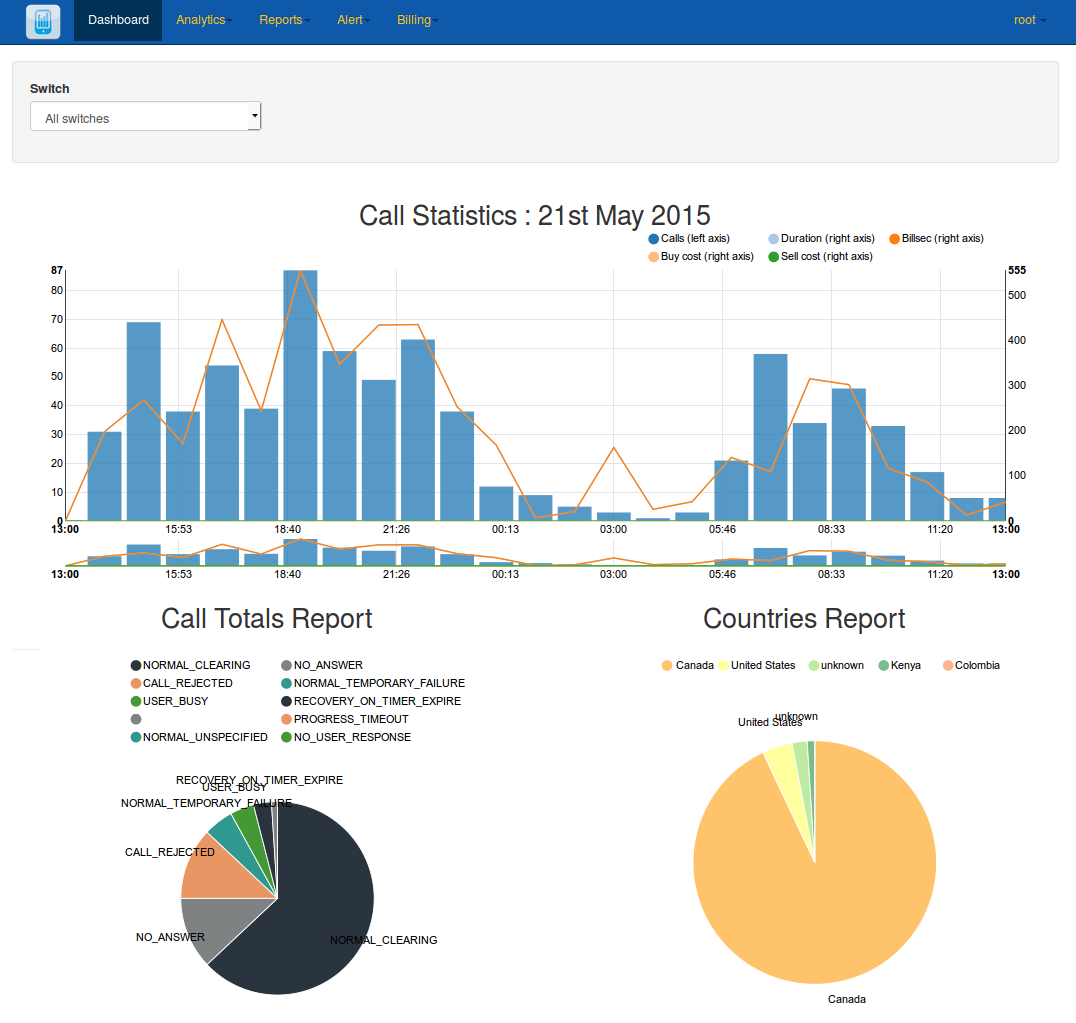
Dashboard
The dashboard displays a graphical representation of the last 24 hours calls, call status statistics and calls by country, either agregrated for all switches, or selectable by switch.
URL:
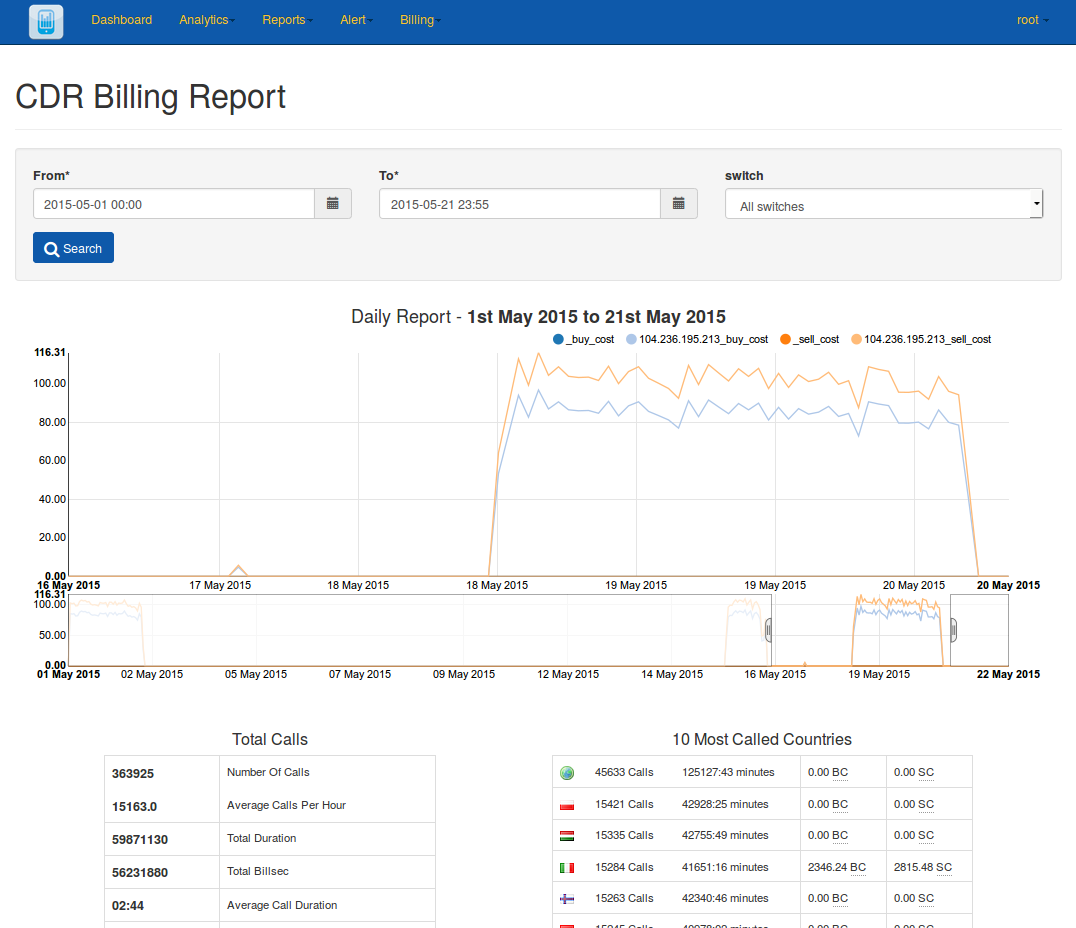
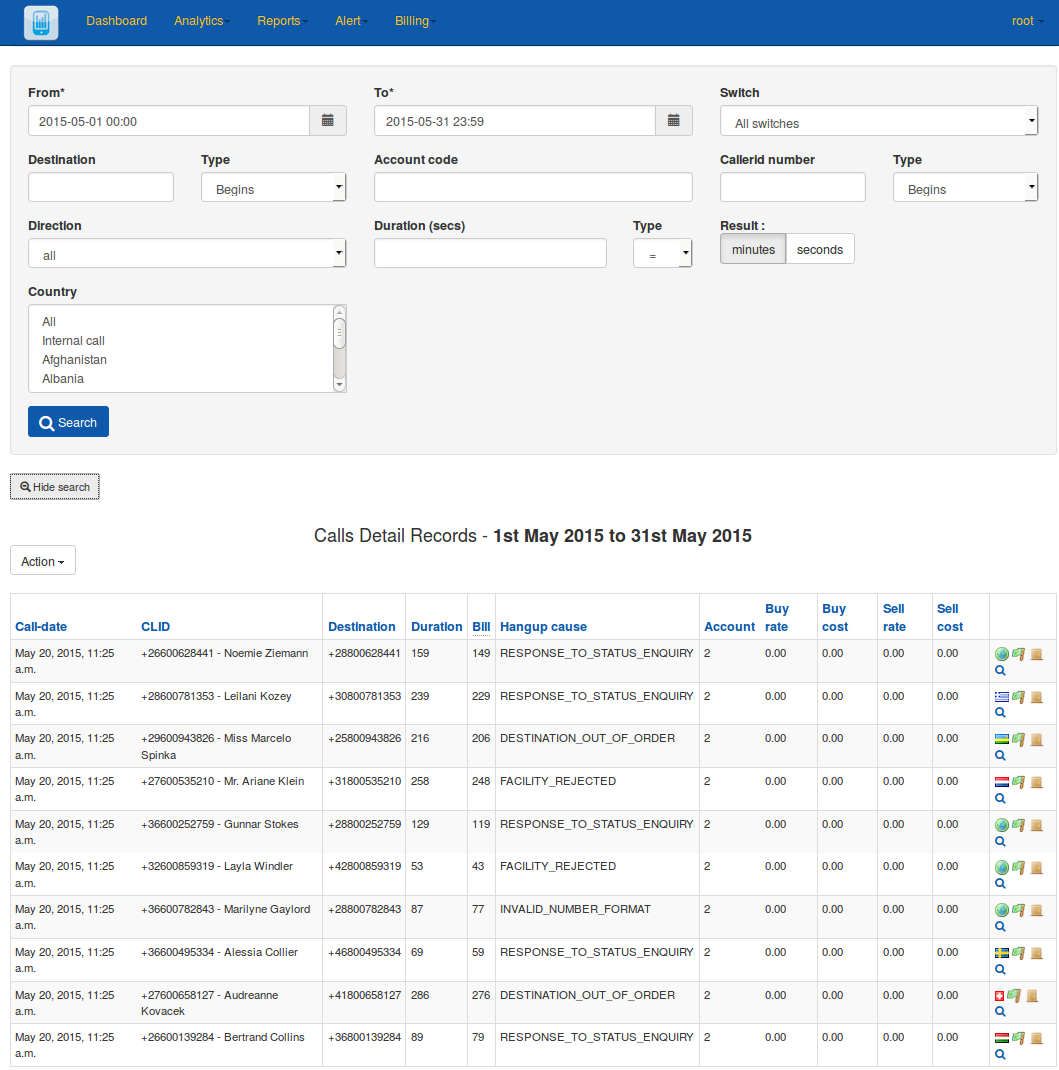
CDR-View
Call detail records listed in table format which can be exported to CSV file.
Advanced Search allows further filtering and searching on a range of criteria
The Report by Day shows a graphical illustration of the calls, minutes and average call time.
URL:
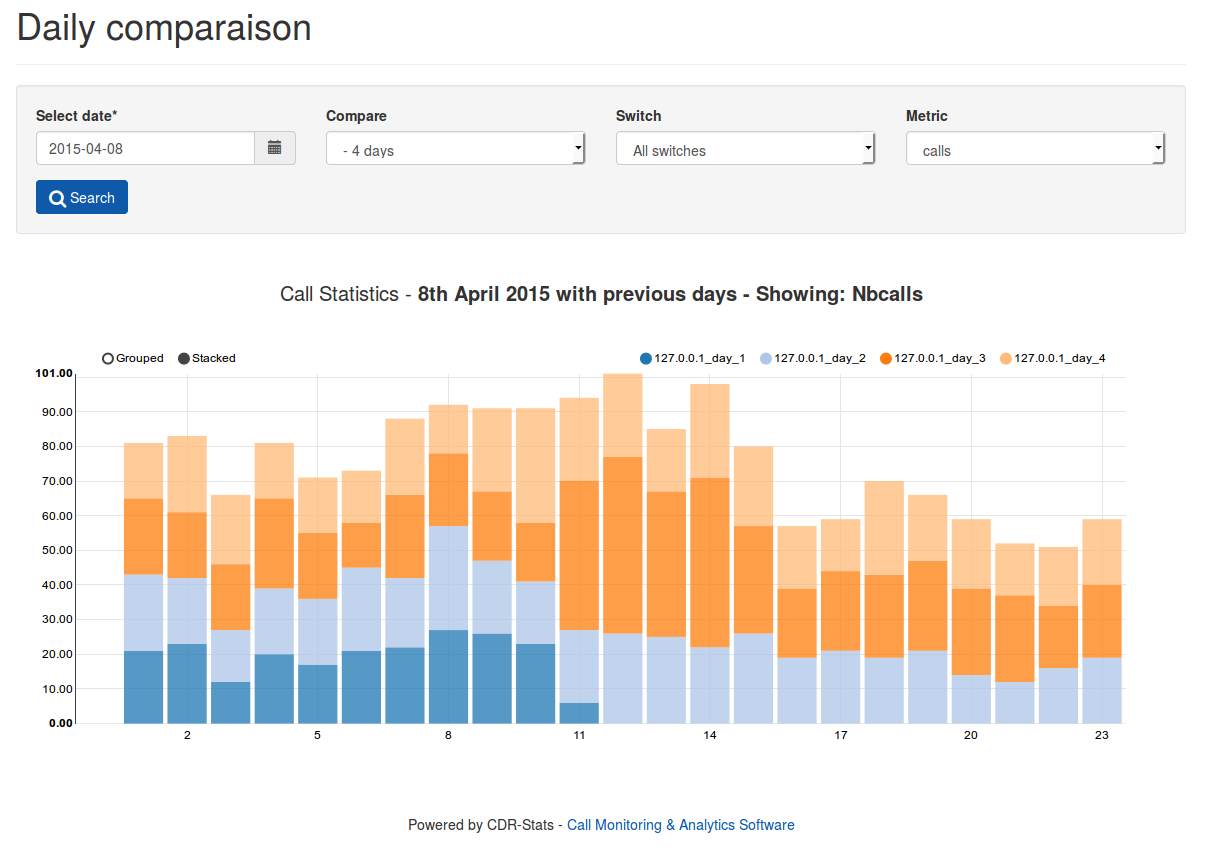
CDR-Overview
A pictorial view of calls with call-count or call-duration from any date or date-range
URL:
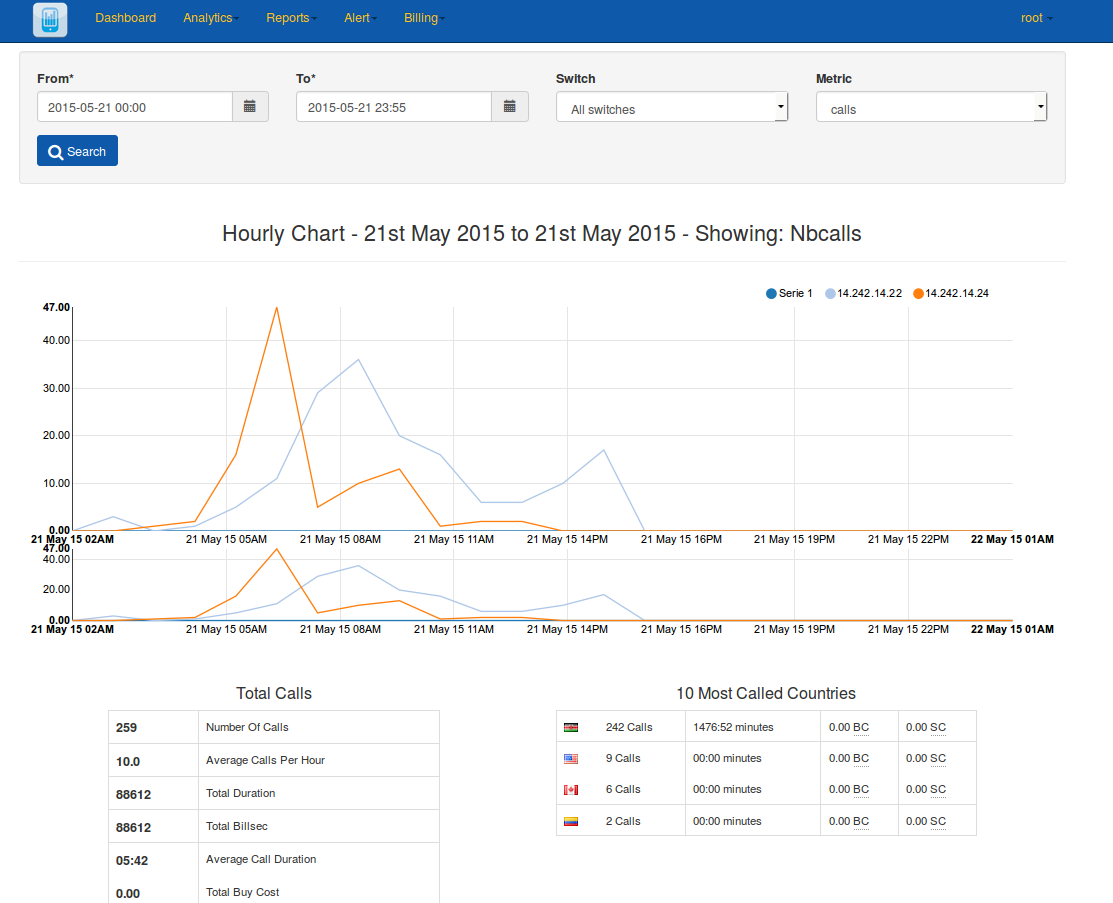
CDR-Hourly-Report
An hourly pictorial view of calls with call-count & call-duration. You can compare different dates
URL:
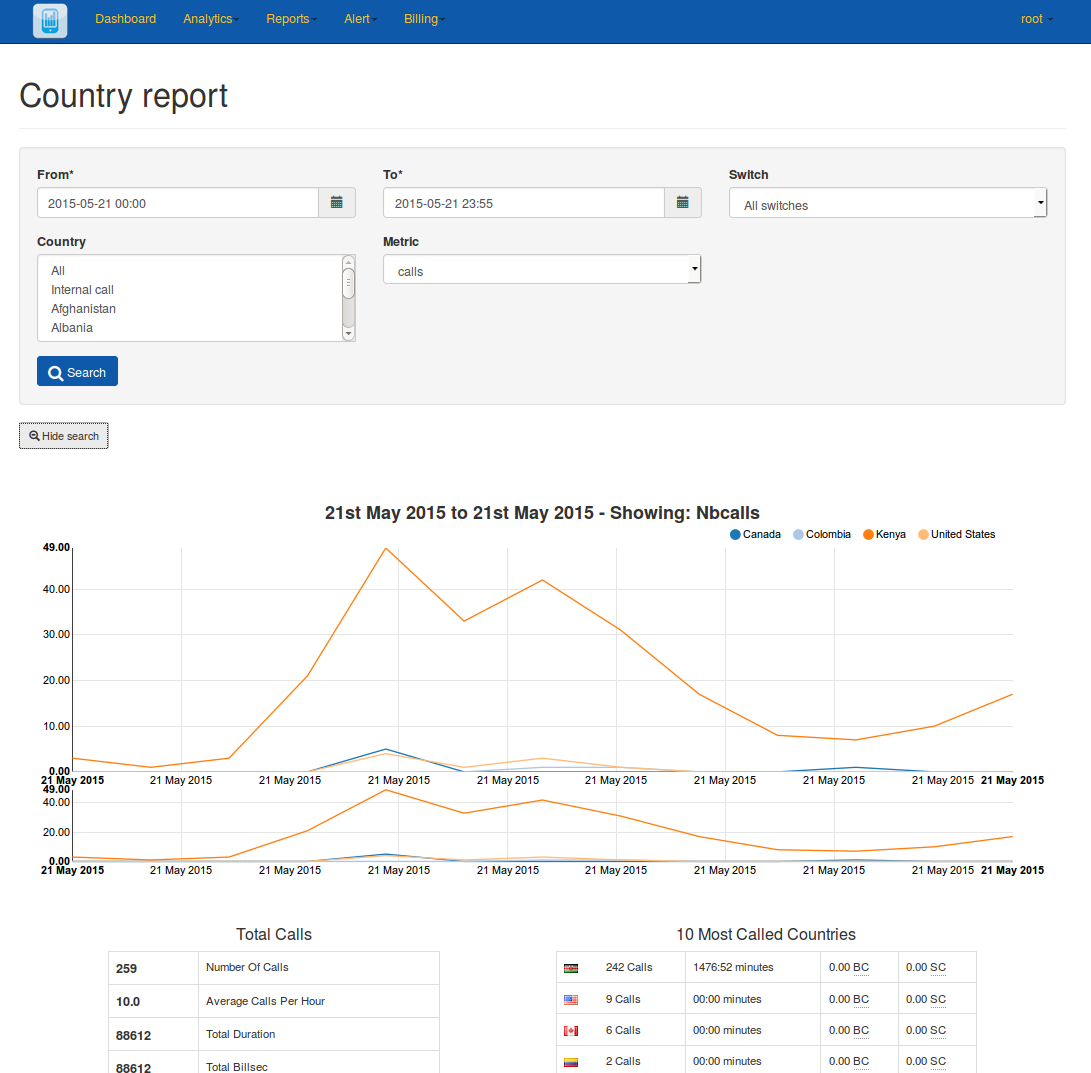
CDR-Country-Report
A pictorial view of all calls by country with the 10 most called countries in a pie chart.
URL:
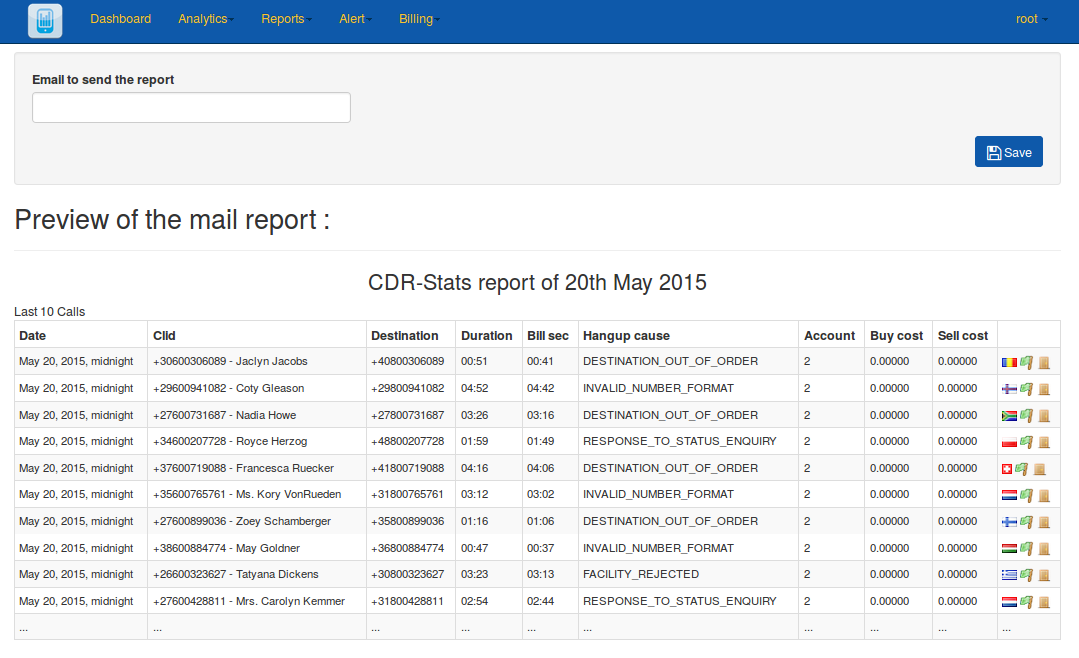
Mail-Report
A list of the last 10 calls of the previous day, along with total calls, a breakdown of the call status, and the top 5 countries called.
This report is emailed automatically, email recipients can be set up in the admin section or by adding an email address in the “Email to send a report” field in the Mail Report section.
URL:
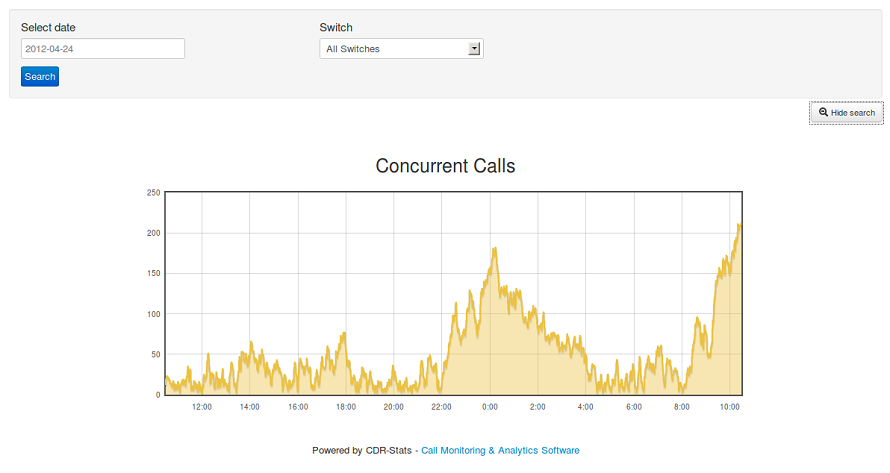
Concurrent-call-report
A report of concurrent calls. The statistics are collated from the realtime report, not from the CDR.
URL:
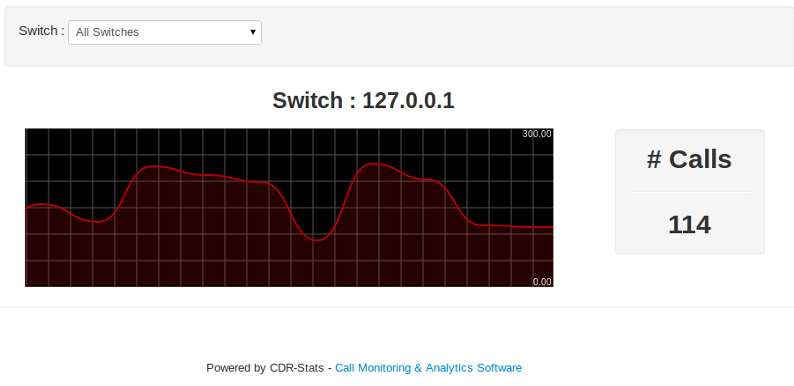
Realtime-Report
Realtime monitoring of the traffic on the connected telecoms servers, Freeswitch and Asterisk are supported.
URL:
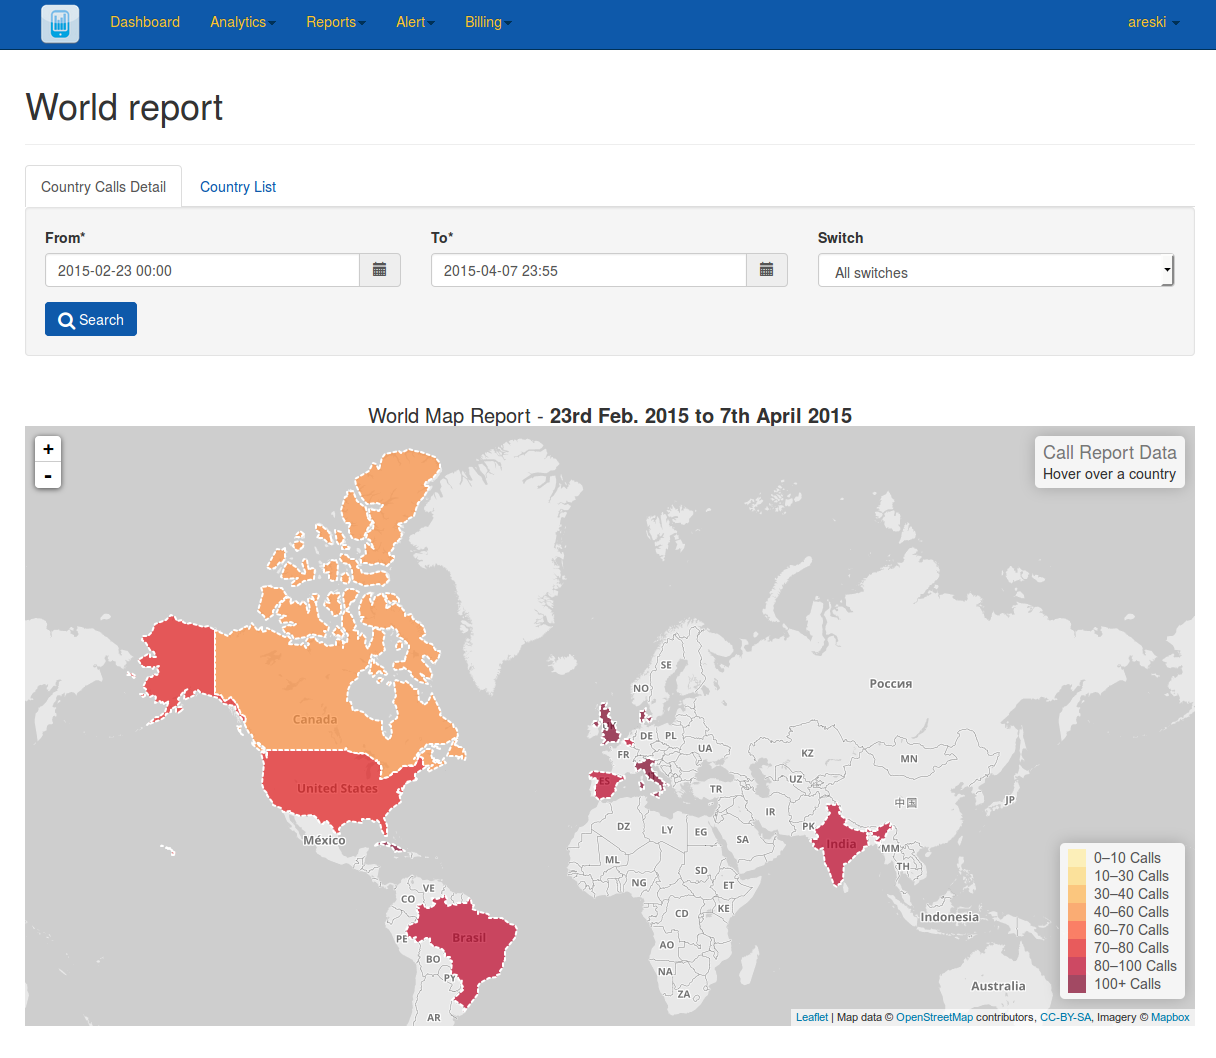
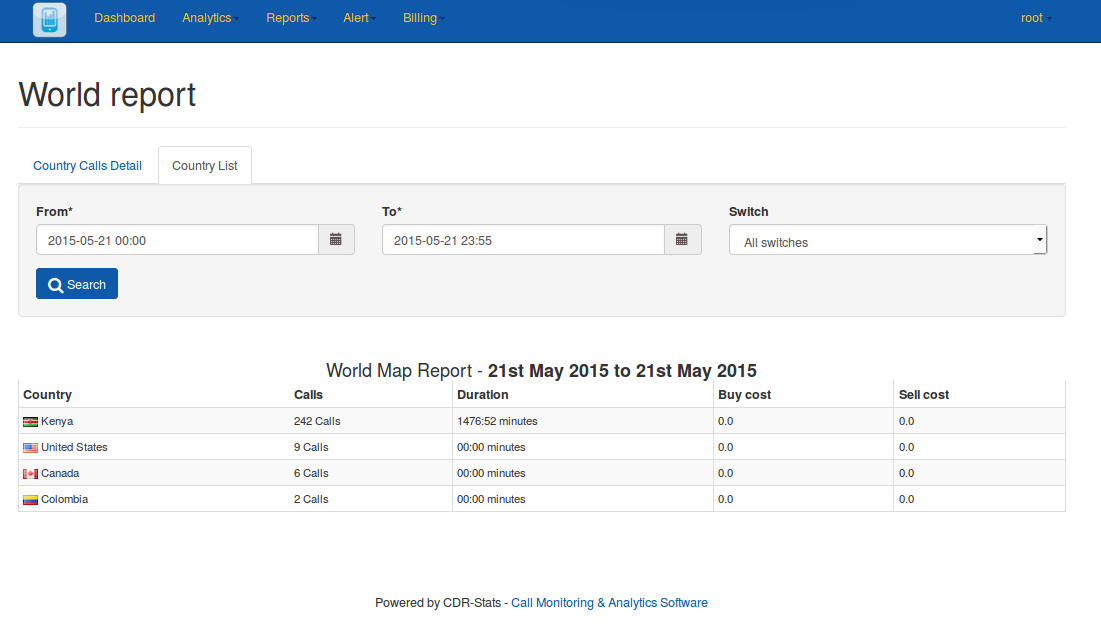
World Map Report
A distriibution map of all calls / durations by country. You can select date criteria and on mouse over on the world map you can get information about each country.
URL: